This is a Kobweb project bootstrapped with the app/empty template.
This template is useful if you already know what you’re doing and just want a clean slate. By default, it
just creates a blank home page (which prints to the console so you can confirm it’s working)
If you are still learning, consider instantiating the app template (or one of the examples) to see actual,
working projects.
Prerequisites
Just provide the following keys in your project level locale.properties file to be able to build the
app with the proper environment
MONGO_URI=""BASE_URL=http://localhost:8080
Getting Started
First, run the development server by typing the following command in a terminal under the site folder:
You can use any editor you want for the project, but we recommend using IntelliJ IDEA Community Edition downloaded
using the Toolbox App.
Press Q in the terminal to gracefully stop the server.
Live Reload
Feel free to edit / add / delete new components, pages, and API endpoints! When you make any changes, the site will
indicate the status of the build and automatically reload when ready.
Exporting the Project
When you are ready to ship, you should shutdown the development server and then export the project using:
kobweb export
When finished, you can run a Kobweb server in production mode:
kobweb run --env prod
If you want to run this command in the Cloud provider of your choice, consider disabling interactive mode since nobody
is sitting around watching the console in that case anyway. To do that, use:
kobweb run --env prod --notty
Kobweb also supports exporting to a static layout which is compatible with static hosting providers, such as GitHub
Pages, Netlify, Firebase, any presumably all the others. You can read more about that approach here: https://bitspittle.dev/blog/2022/staticdeploy
Linter, CMake, GH Hooks and other tools for standardizing CXX projects.
Overview
This repo provides a growing list of tools.
CMake linter
CXX linter
Git hooks
This tools aim to support best coding practices like linting files, configuring
a Git pre-commit hook, etc.
The main motivation for developing these tools is to address an issue that
typically affects code bases that are organized into multiple repositories. In
the example of a CMake linter:
each repository may host a copy of the configuration that the linter must use
each repository may define a different version of the linter
Both elements contribute to introduce discrepancies in the code formatting and
make the maintenance of the code base across multiple repositories more
difficult.
The solution proposed is to define both tools and configurations in
one repository. This repository can then be added as a Git submodule to
multiple repositories that will then benefit from the same tools and
configurations.
Requirements
The following programs must be installed before using the tools provided by the
repository.
Run the following command to add the CXX dev tools to the PATH.
cd dev-cxx-tools &&. export.sh
If you want to customize the tool versions and configuration, then fork this
repository before adding it as a submodule to your projects.
Tools
cxxdt-cmake-lint
Checks if the format of the specified CMake files is compliant with the CMake
style configuration defined in this repository (cmake/config).
$ cxxdt-cmake-lint test/cmake-lint/samples/invalid-format.cmake
test/cmake-lint/samples/invalid-format.cmake
============================================
test/cmake-lint/samples/invalid-format.cmake:10,04: [C0305] too many newlines between statements
Summary
=======
files scanned: 1
found lint:
Convention: 1
$ echo$?
1
$ cxxdt-cmake-lint test/cmake-lint/samples/valid-format.cmake
test/cmake-lint/samples/valid-format.cmake
==========================================
Summary
=======
files scanned: 1
found lint:
$ echo$?
0
The exit status returned is 0 if the format of the file is valid.
If no CMake files are specified, cxxdt-cmake-lint tries to read a list CMake
files from ./.cxxdt-cmake-lint (one file/file expression per line). The
following command is used in the CI configuration of this repo to check that the
CMake module BuildType.cmake is correctly formatted.
Formats the specified CMake files using the CMake style configuration defined
in this repository. The CML interface is the same as cxxdt-cmake-lint.
cxxdt-cxx-lint
Checks if the format of the specified CXX files is compliant with the CXX
style configuration defined in this repository (cxx/config).
The CML interface is the same as cxxdt-cmake-lint.
cxxdt-cxx-format
Formats the specified CXX files using the CXX style configuration defined
in this repository. The CML interface is the same as cxxdt-cmake-lint.
GitHub tools
.githook/pre-commit – Validates .circleci/config.yml
before acceptiing a commit.
Continuous Integration
An example of integration of cxx-dev-tools into a CI configuration is
available in .circleci/config.yml.
A Machine Learning Model for Predicting Price of House from California Census 1990
This Machine Learning Model is Derived From Hands on ML Book by Aurelien Geron.
Your Python Version Should Be Between python3.7 or python 3.10 because kivy don’t Supports python3.11
Description about Model
This is a Machine Learning Model that can Predict Prices of House Which are at California.
The Price Predicted By This Model is according to Census of 1990.
I Have Used Sciket-learn in This Project
Description about Webiste
I have Used Python-Django FrameWork in this Project.
I have used Tailwind CSS as a Frontend FrameWork
Here i Converted My Model in .pkl file With The help of joblib module in python.
I Have Created a model.py file in which i have the pipeline and a function name request_prediction().
if i Give The data into request_prediction() function it first executes the pipeline in which my data is transformed in many ways and then it is feeded to the machine learning model and output is returned.
Then its Returned Information is Presented as Prediction in our next Page Using Django.
Description about GUI’s
I have Used Python-Tkinter and Python-Kivy FrameWork in this Project.
Here i used the same .pkl file in this Project.
I have also used The same model.py file.
I Have Taken all inputs in form of string then converted it in float then feed it to Machine Learning Model.
Now You are Ready to run this on Your Local Machine.
Conclusion
If You Notice any Bugs in our Code or You Think That you Can Make This Code a Little Bit Better Than Don’t Hesistate You Can Do Two Things in That Case
First Thing is That You Can Raise an Issue.
Second Thing is That You Can Open a Pull Request I Will be Very Happy to See Your Code and if it is Good Than i Will Definetly Add it to My Main Repository.
If you want to contribute to this repository, feel free to use our pre-commit git hook configuration
which will help you automatically update and format some files for you by enforcing our Terraform code module best-practices.
This module is optimized to work with the Claranet terraform-wrapper tool
which set some terraform variables in the environment needed by this module.
More details about variables set by the terraform-wrapper available in the documentation.
⚠️ Since modules version v8.0.0, we do not maintain/check anymore the compatibility with
Hashicorp Terraform. Instead, we recommend to use OpenTofu.
Text2Graph: Autonomous Knowledge Graph Construction Framework
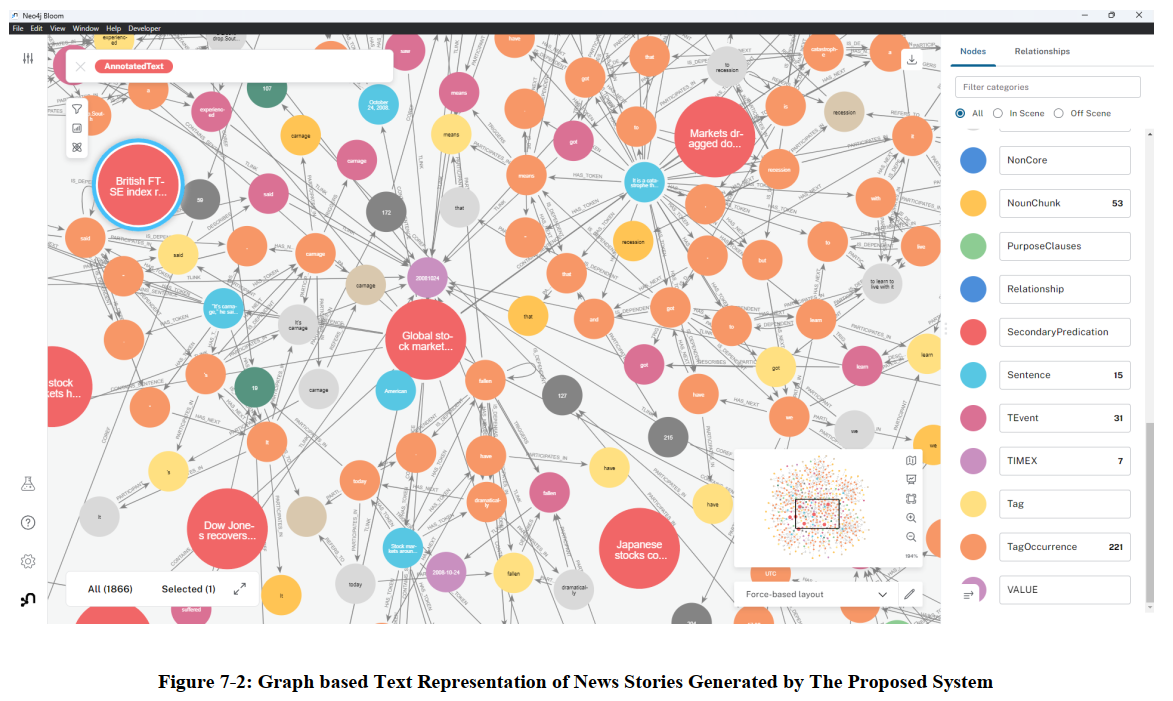
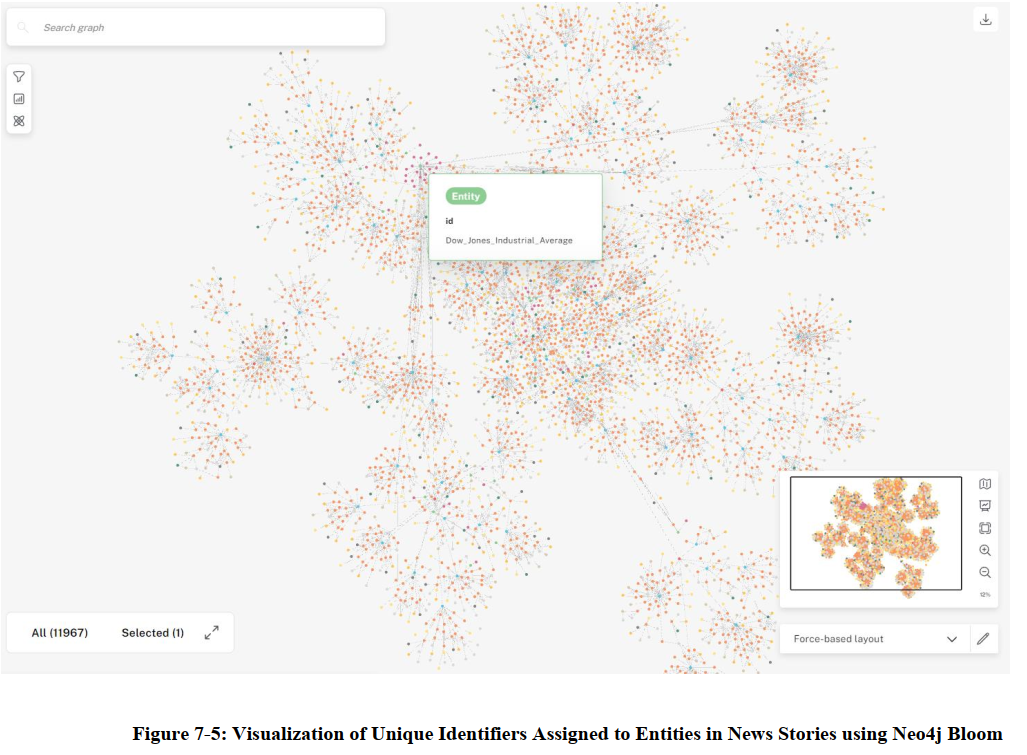
Text2Graph is a Python-based framework for the autonomous construction of domain-specific Knowledge Graphs (KG) from unstructured text data. The system transforms textual data into a labeled property graph-based representation using various NLP and semantic processing tools and integrates with Neo4j for graph storage and querying.
Features
Automated NLP pipeline for entity extraction, relation extraction, and semantic enrichment.
Integration with Neo4j for graph-based storage and querying.
Support for large-scale Knowledge Graphs with rich domain-specific entity typing, event tagging, and temporal relationships.
Extensible and schema-free architecture.
Requirements
System Requirements
Ubuntu Linux (or Windows Subsystem for Linux (WSL))
Neo4j 4.4 with APOC plugin
Docker for external NLP services
Python 3.8+
Python Dependencies
Ensure Python 3.8+ is installed. You can install the required dependencies using the following instructions:
Clone the repository
git clone https://github.com/neostrange/text2graph.git
cd text2graph
For Word Sesnse Disambiguation, text2graph uses AMuSE-WSD.
Please Follow the instructions given in AMUSE-WSD:
Download the Docker image for AMUSE-WSD
Expose on localhost:81:
docker run -p 81:81 amuse/amuse-wsd
Semantic Role Labeling:
text2graph uses AllenNlp to perform semantic role labeling. You can find the instrcutions to setup docker container for AllenNlp SRL
From AllenNLP Docker:
Expose on localhost:8000:
docker run -p 8000:8000 allennlp/allennlp
Make sure all Docker services are running before initiating the text2graph pipeline to ensure full functionality for entity enrichment, event tagging, and temporal expressions.
WSL Specific Setup
If you’re running the project on WSL (Windows Subsystem for Linux), you may need to configure the firewall:
Add WSL to Windows Firewall:
Run the following command in PowerShell (as Administrator):
After applying the firewall rule, restart your computer.
Usage Instructions
Set up the Python Path (optional):
If you need to work with nested directories, you can add the current working directory to the Python path:
export PYTHONPATH="$(pwd):$PYTHONPATH"
Run the Pipeline
The Text2Graph pipeline is a modular system designed to efficiently generate Knowledge Graphs from textual data. It consists of several distinct phases, each focusing on specific NLP tasks. Let’s walk through how to run the pipeline and explore each phase:
Phase 1: Basic Linguistic Analysis (python3 GraphBasedNLP.py –input /path/to/text/documents)
Function: This phase performs the foundational tasks of Natural Language Processing (NLP) on the input text documents.
Input: You can specify the path to your text documents using the --input argument. If no argument is provided, the script will load text data files by default from the data/dataset folder within the Text2Graph repository. Currently, this folder contains pre-loaded files from the MEANTIME corpus for your convenience.
Running Phase 1:
Open a terminal window and navigate to the directory containing the GraphBasedNLP.py script within your Text2Graph installation.
(Optional) If you have your own text documents, execute the script with the --input argument followed by the path to your data directory:
If you’d like to use the pre-loaded MEANTIME corpus data, simply run the script without any arguments:
python3 GraphBasedNLP.py```
Phase 2: Refinement Phase
Function: This phase focuses on refining the extracted information from Phase 1. It establishes connections between different linguistic elements and ensures consistency within the data.
Input: The output from Phase 1 (typically stored in a Neo4j database) serves as the input for this phase.
Running Phase 2:
Ensure Phase 1 has completed successfully.
Navigate to the directory containing the RefinementPhase.py script.
Execute the script
python3 RefinementPhase.py
Phase 3: Temporal Enrichment
Function: This phase enriches the Knowledge Graph with temporal information. It involves identifying and tagging time expressions and event triggers within the text data.
Input: The refined data from Phase 2 is used as input for this phase.
Running Phase 3:
Ensure Phases 1 and 2 have completed successfully.
Navigate to the directory containing the TemporalPhase.py script.
Execute the script:
python3 TemporalPhase.py
Phase 4: Event Enrichment
Function: This phase focuses on enriching event information within the Knowledge Graph. It establishes links between identified events and entities, as well as other events, based on the linguistic elements present in the graph.
Input: The temporally enriched data from Phase 3 is used as input for this phase.
Running Phase 4:
Ensure Phases 1, 2 and 3 have completed successfully.
Navigate to the directory containing the EventEnrichmentPhase.py script.
Execute the script:
python3 EventEnrichmentPhase.py
Phase 5: TLink Recognition
Function: This phase aims to identify Temporal Links (TLinks) within the Knowledge Graph. TLinks describe temporal relationships between events, such as “before,” “after,” or “during”. Input: The event-enriched data from phase 4, will serve as input for TLink recognition.
Running Phase 5:
Ensure all the previous steps have been completed.
Navigate to the directory containing TlinksRecognizer.py script.
Execute the script:
python3 TlinksRecognizer.py
Neo4j Interaction
Note: While the REST endpoints powered by FastAPI are not yet implemented, you can still interact with the generated Knowledge Graph directly through the Neo4j Browser or Neo4j Bloom.
These tools provide a user-friendly interface for exploring and querying the graph data. You can execute Cypher queries to retrieve specific information or visualize the graph structure.
Screenshots
Publications
A. Hur, N. Janjua, and M. Ahmed, “A Survey on State-of-the-art Techniques for Knowledge Graphs Construction and Challenges ahead,” 2021 IEEE Fourth International Conference on Artificial Intelligence and Knowledge Engineering (AIKE), Laguna Hills, CA, USA, 2021, pp. 99-103, doi: 10.1109/AIKE52691.2021.00021.
Ali Hur, Naeem Janjua, and Mohiuddin Ahmed, “Unifying context with labeled property graph: A pipeline-based system for comprehensive text representation in NLP,” Expert Systems with Applications, Volume 239, 2024, 122269, doi: 10.1016/j.eswa.2023.122269.
Contributing to Text2Graph
We welcome contributions to Text2Graph! If you encounter any bugs, have feature requests, or wish to contribute new functionality, please submit a pull request or open an issue on our GitHub repository. Your contributions help us enhance Text2Graph and make it more valuable for the community.
Thank you for your support!
License
This project is licensed under the MIT License. See the LICENSE file for details.
CAFE (Computational Analysis of gene Family
Evolution) is a software that provides a statistical foundation for evolutionary
inferences about changes in gene family size.
The visualization and interpretation of CAFE results usually requires custom
scripts. Here, I provide such a custom script.
CAFE_fig takes a .cafe output file and produces:
a summary tree that shows the average expansion/contraction of families across the phylogeny
a tree that denotes which branches evolve under which lambda (if a model with multiple lambdas was used)
a tree for each family of interest, i.e. families that the user specified by ID or families that showed significant change at a user-specified clade of interest
Requirements
CAFE_fig requires Python3.4+ and ETE3:
Install ETE3 with
pip3 install 'ete3==3.0.0b35'
It’s important that you use ETE3 version 3.0.0b35 since it appears that the latest ETE3 version causes problems that are beyond my control (see issue #1). This ETE3 version runs well with PyQt4 but not PyQt5, so if you’re experiencing issues it’s worth a try to switch to PyQt4.
Usage
usage: CAFE_fig.py [-h] [-f FAMILIES [FAMILIES ...]] [-c CLADES [CLADES ...]]
                   [-pb PB] [-pf PF] [-d DUMP] [-g GFX_OUTPUT_FORMAT]
                   [--count_all_expansions]
                   report_cafe

Parses a CAFE output file (.cafe) and plots a summary tree that shows the
average expansion/contraction across the phylogeny; a tree that shows which
clades evolved under the same lambda (if available); and a gene family
evolution tree for each user-specified gene family.

positional arguments:
  report_cafe           the file report.cafe (or similar name)

optional arguments:
  -h, --help            show this help message and exit
  -f FAMILIES [FAMILIES ...], --families FAMILIES [FAMILIES ...]
                        only show families with these IDs
  -c CLADES [CLADES ...], --clades CLADES [CLADES ...]
                        only show families that are expanded/contracted at
                        this clade. Format: [clade]=[leaf],[leaf] where clade
                        is the name of the last common ancestor of the two
                        leaves, e.g.: Isoptera=zne,mna
  -pb PB                branch p-value cutoff (default: 0.05)
  -pf PF                family p-value cutoff (default: 0.05)
  -d DUMP, --dump DUMP  don't open trees in a window, write them to files in
                        the specified directory instead (default: off)
  -g GFX_OUTPUT_FORMAT, --gfx_output_format GFX_OUTPUT_FORMAT
                        output format for the tree figures when using --dump
                        [svg|pdf|png] (default: pdf)
  --count_all_expansions
                        count and write down the number of *all* expansions
                        and contractions (default: only count significant
                        expansions/contractions)
Example outputs
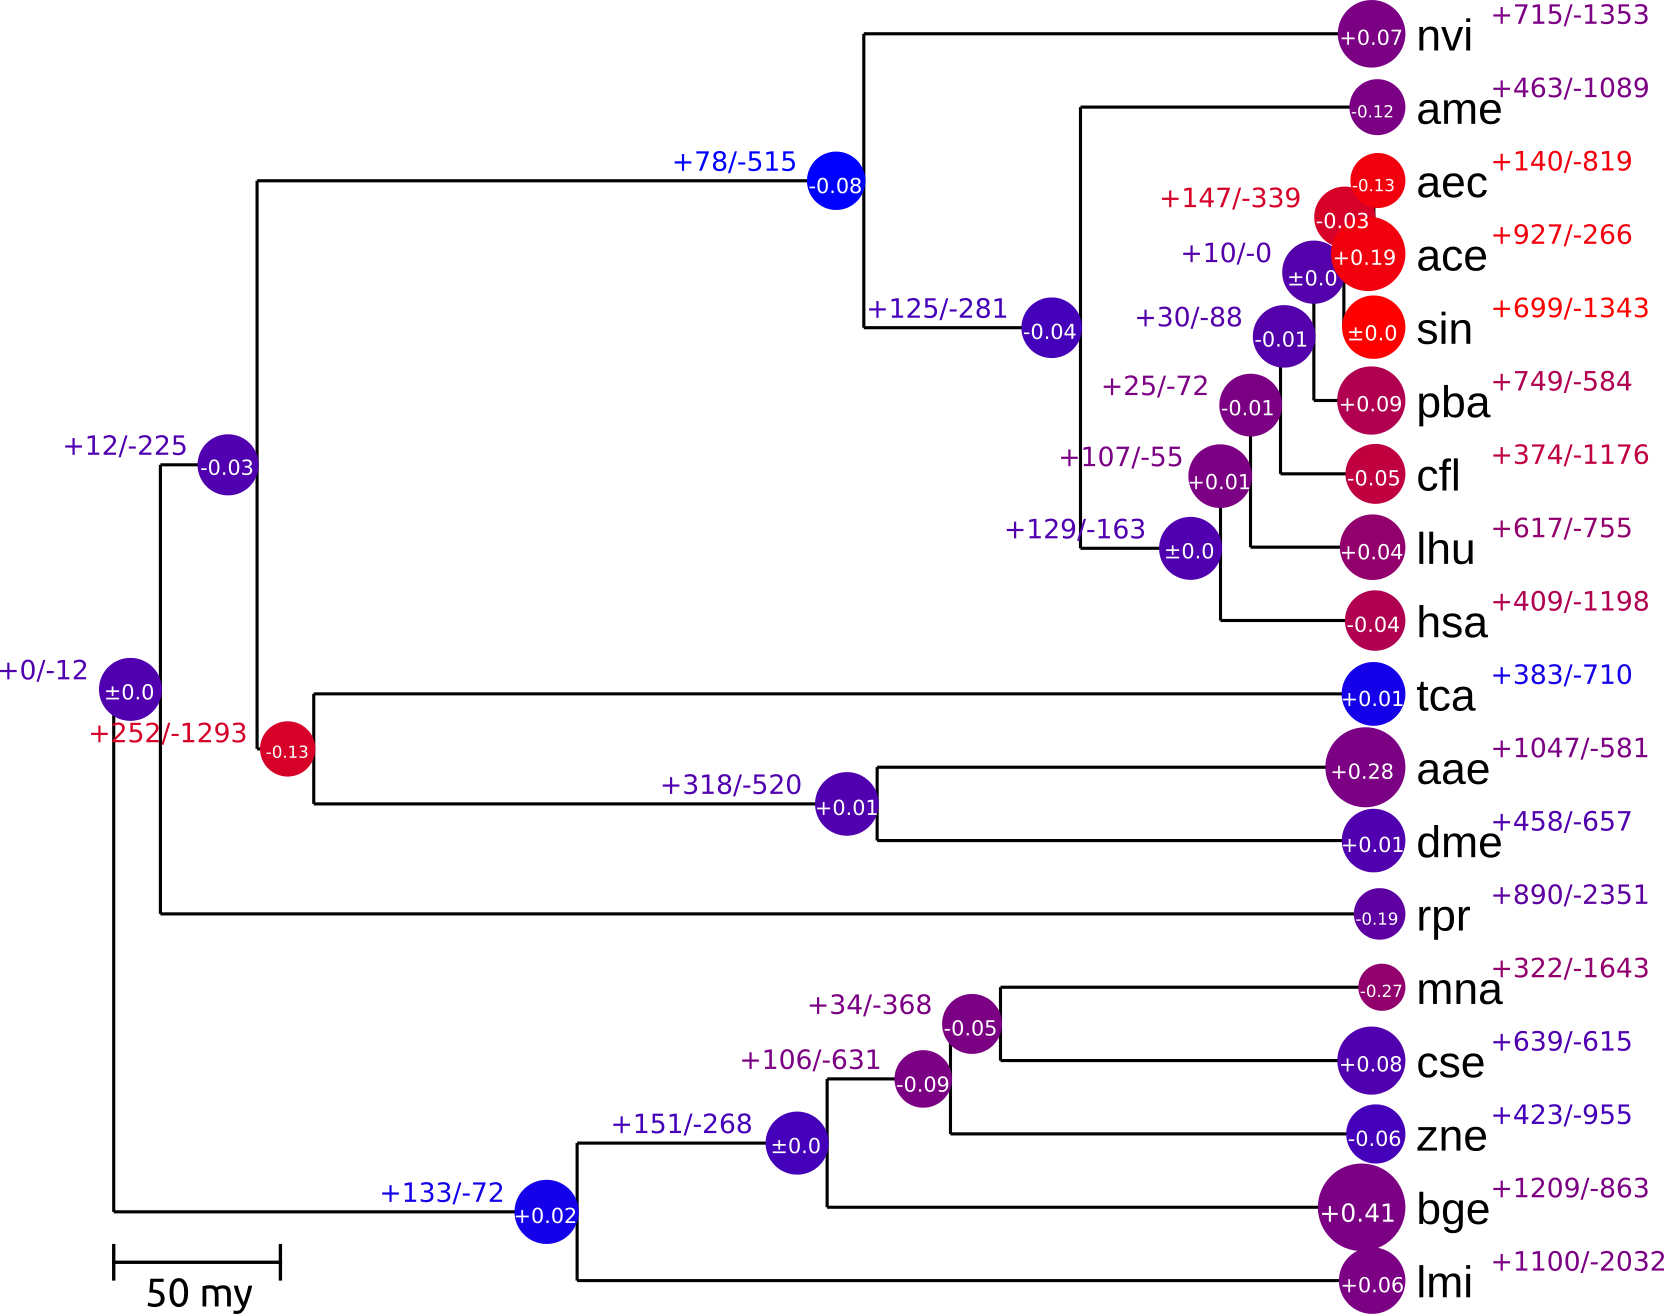
Summary tree that shows the average expansion/contraction (radius of node circles),
the numbers of expanded/contracted families (+/-), and the estimated gene gain/loss
rates (blue: low rate; red: high rate).
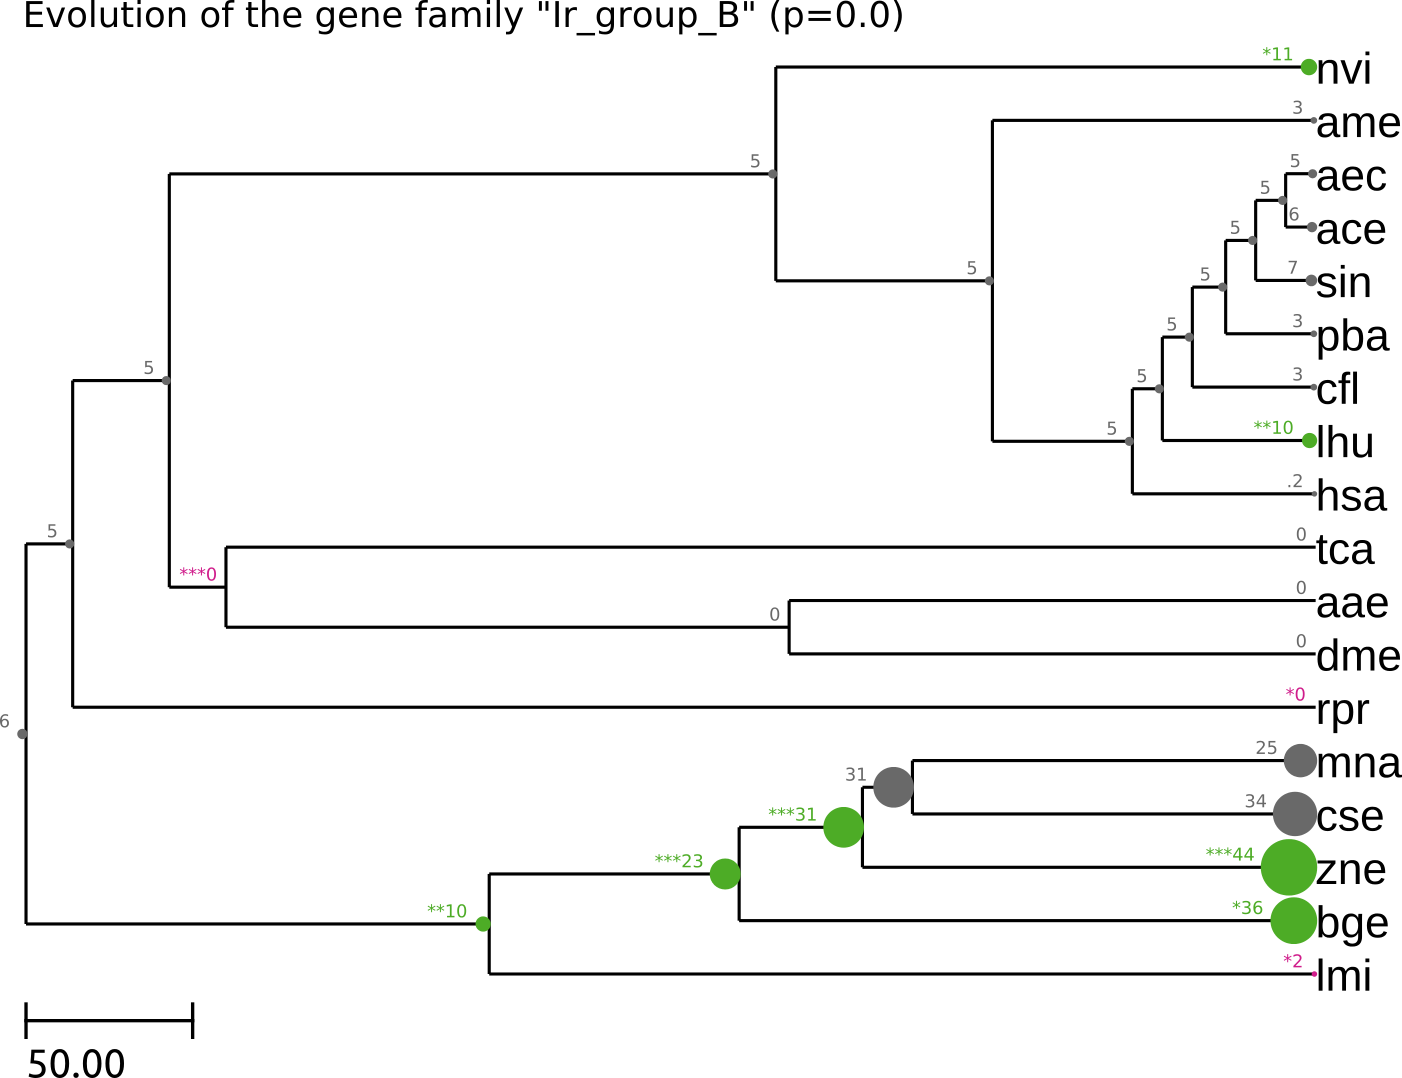
Example output for a specific gene family. Numbers and node sizes represent the family size at each node.
Significant expansions are shown in green, significant contractions in magenta.
Example usage
To recreate the plots shown above, use this command:
This reads “example_result.cafe” and dumps all figures in PDF format to the directory “test/”. The summary tree (“summary.pdf”) will show the whole phylogeny and the number of expansions and contractions (including insignificant ones!) as shown below. Further family-wise trees will be created and dumped in the directory “test/families”. These trees will only be created for families that showed a significant (p<=0.05) expansion/contraction at the node “Isoptera”, which is the last common ancestor of “zne” and “mna”.
Significant contractions are marked in magenta, significant expansions are marked in green (p<=0.001 = ***, p<=0.01 = **, p<=0.05 = *).
Known issues
The error message module 'ete3' has no attribute 'TreeStyle' is caused by a known problem with ete3 that is beyond my control.
Check this link for possible solutions!.
CAFE (Computational Analysis of gene Family
Evolution) is a software that provides a statistical foundation for evolutionary
inferences about changes in gene family size.
The visualization and interpretation of CAFE results usually requires custom
scripts. Here, I provide such a custom script.
CAFE_fig takes a .cafe output file and produces:
a summary tree that shows the average expansion/contraction of families across the phylogeny
a tree that denotes which branches evolve under which lambda (if a model with multiple lambdas was used)
a tree for each family of interest, i.e. families that the user specified by ID or families that showed significant change at a user-specified clade of interest
Requirements
CAFE_fig requires Python3.4+ and ETE3:
Install ETE3 with
pip3 install 'ete3==3.0.0b35'
It’s important that you use ETE3 version 3.0.0b35 since it appears that the latest ETE3 version causes problems that are beyond my control (see issue #1). This ETE3 version runs well with PyQt4 but not PyQt5, so if you’re experiencing issues it’s worth a try to switch to PyQt4.
Usage
usage: CAFE_fig.py [-h] [-f FAMILIES [FAMILIES ...]] [-c CLADES [CLADES ...]]
                   [-pb PB] [-pf PF] [-d DUMP] [-g GFX_OUTPUT_FORMAT]
                   [--count_all_expansions]
                   report_cafe

Parses a CAFE output file (.cafe) and plots a summary tree that shows the
average expansion/contraction across the phylogeny; a tree that shows which
clades evolved under the same lambda (if available); and a gene family
evolution tree for each user-specified gene family.

positional arguments:
  report_cafe           the file report.cafe (or similar name)

optional arguments:
  -h, --help            show this help message and exit
  -f FAMILIES [FAMILIES ...], --families FAMILIES [FAMILIES ...]
                        only show families with these IDs
  -c CLADES [CLADES ...], --clades CLADES [CLADES ...]
                        only show families that are expanded/contracted at
                        this clade. Format: [clade]=[leaf],[leaf] where clade
                        is the name of the last common ancestor of the two
                        leaves, e.g.: Isoptera=zne,mna
  -pb PB                branch p-value cutoff (default: 0.05)
  -pf PF                family p-value cutoff (default: 0.05)
  -d DUMP, --dump DUMP  don't open trees in a window, write them to files in
                        the specified directory instead (default: off)
  -g GFX_OUTPUT_FORMAT, --gfx_output_format GFX_OUTPUT_FORMAT
                        output format for the tree figures when using --dump
                        [svg|pdf|png] (default: pdf)
  --count_all_expansions
                        count and write down the number of *all* expansions
                        and contractions (default: only count significant
                        expansions/contractions)
Example outputs
Summary tree that shows the average expansion/contraction (radius of node circles),
the numbers of expanded/contracted families (+/-), and the estimated gene gain/loss
rates (blue: low rate; red: high rate).
Example output for a specific gene family. Numbers and node sizes represent the family size at each node.
Significant expansions are shown in green, significant contractions in magenta.
Example usage
To recreate the plots shown above, use this command:
This reads “example_result.cafe” and dumps all figures in PDF format to the directory “test/”. The summary tree (“summary.pdf”) will show the whole phylogeny and the number of expansions and contractions (including insignificant ones!) as shown below. Further family-wise trees will be created and dumped in the directory “test/families”. These trees will only be created for families that showed a significant (p<=0.05) expansion/contraction at the node “Isoptera”, which is the last common ancestor of “zne” and “mna”.
Significant contractions are marked in magenta, significant expansions are marked in green (p<=0.001 = ***, p<=0.01 = **, p<=0.05 = *).
Known issues
The error message module 'ete3' has no attribute 'TreeStyle' is caused by a known problem with ete3 that is beyond my control.
Check this link for possible solutions!.
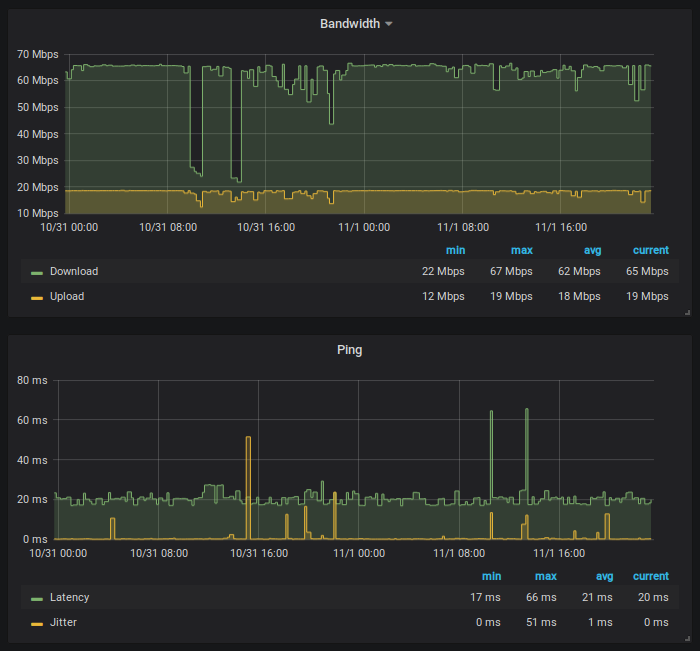
This is a small Python script that will continuously run the Speedtest CLI application by Ookla, reformat the data output and forward it on to an InfluxDB database.
You may want to do this so that you can track your internet connections consistency over time. Using Grafana you can view and explore this data easily.
Using the script
Adjust the InfluxDB connection settings at the top of main.py to fit your setup and then run with one of the options listed below.
Be aware that this script will automatically accept the license and GDPR statement so that it can run non-interactively. Make sure you agree with them before running.
NOTE: The speedtest-cli package in distro repositories is an unofficial client. It will need to be uninstalled before installing the Ookla Speedtest CLI application with the directions on their website.
Install the InfluxDB client for library from Python.
Multimodal dynamics of explaining the mechanisms of global warming
This repo contains the Jupyter notebooks for the analyses underlying Multimodal dynamics of explaining the mechanisms of global warming (Paxton, Abney, Castellanos, & Sepulveda, 2016), a poster presented at the 2016 Annual Conference of the Cognitive Science Society.
Due to ethical considerations for participant privacy, we cannot publicly share files that include participant data.
Overview of experiment procedures
In the current experiment, we asked participants to watch a 5-minute video explaining the mechanisms behind global warming (“How Global Warming Works in Under 5 Minutes”; Ranney, Lamprey, Reinholz, Le, Ranney, & Goldwasser, 2013). After watching the video (and a 30-second waiting period), participants were asked to explain the mechanisms aloud in less than 2 minutes so that a future participant could learn the information.
Participants’ gaze and attention throughout the experiment were captured using a remote eye-tracker (SMI Red-m).
Comprehension was derived as the similarity between each participant’s explanation and the video’s transcript using latent semantic analysis (LSA) implemented in the LSAfun package in R (Gunther, Dudschig, & Kaup, 2015).
Overview of repo contents
This repo contains several Jupyter notebooks, supplementary analysis files, figures, and a copy of the poster.
dyn_exp-step2-data_cleaning.ipynb: A Jupyter notebook running a Python kernel to clean up participants’ transcripts.
dyn_exp-step3-data_preparation.ipynb: A Jupyter notebook running an R kernel to prepare data for later analysis.
dyn_exp-step4-data_analysis.ipynb: A Jupyter notebook running an R kernel to execute the data analysis plan for the current project.
dyn_exp-poster-cogsci-2016.pdf: A PDF of the poster.
figures/: A directory containing all images produced by the Jupyter notebooks.
supplementary_code: A directory containing additional files to help clean the data (e.g., defining new functions, importing libraries).
global-warming-transcript.txt: A transcript of the video watched by participants (“How Global Warming Works in Under 5 Minutes”; Ranney, Lamprey, Reinholz, Le, Ranney, & Goldwasser, 2013).
This sample demonstrates how to run TensorFlow inference on Android Things.
When a GPIO button is pushed, the current image is captured from an attached
camera. The captured image is then converted and piped into a TensorFlow model
that identifies what is in the image. Up to three labels returned by the
TensorFlow network is shown on logcat and on the screen, if there is an
attached display. Also, the result is spoken out loud using text-to-speech and
sent to an attached speaker, if any.
This project is based on the TensorFlow Android Camera Demo TF_Classify app.
The TensorFlow training was done using Google inception model and the trained data set
is used to run inference and generate classification labels via TensorFlow Android Inference
APIs.
The AAR in app/libs is built by combining the native
libraries for x86 and ARM platforms from the
Android TensorFlow inference library.
By using this AAR, the app does not need to be built with the NDK toolset.
Note: this sample requires a camera. Find an appropriate board in the documentation.
Pre-requisites
Android Things compatible board e.g. Raspberry Pi 3
Android Things compatible camera e.g. Raspberry Pi 3 camera module
Android Studio 2.2+
The following individual components:
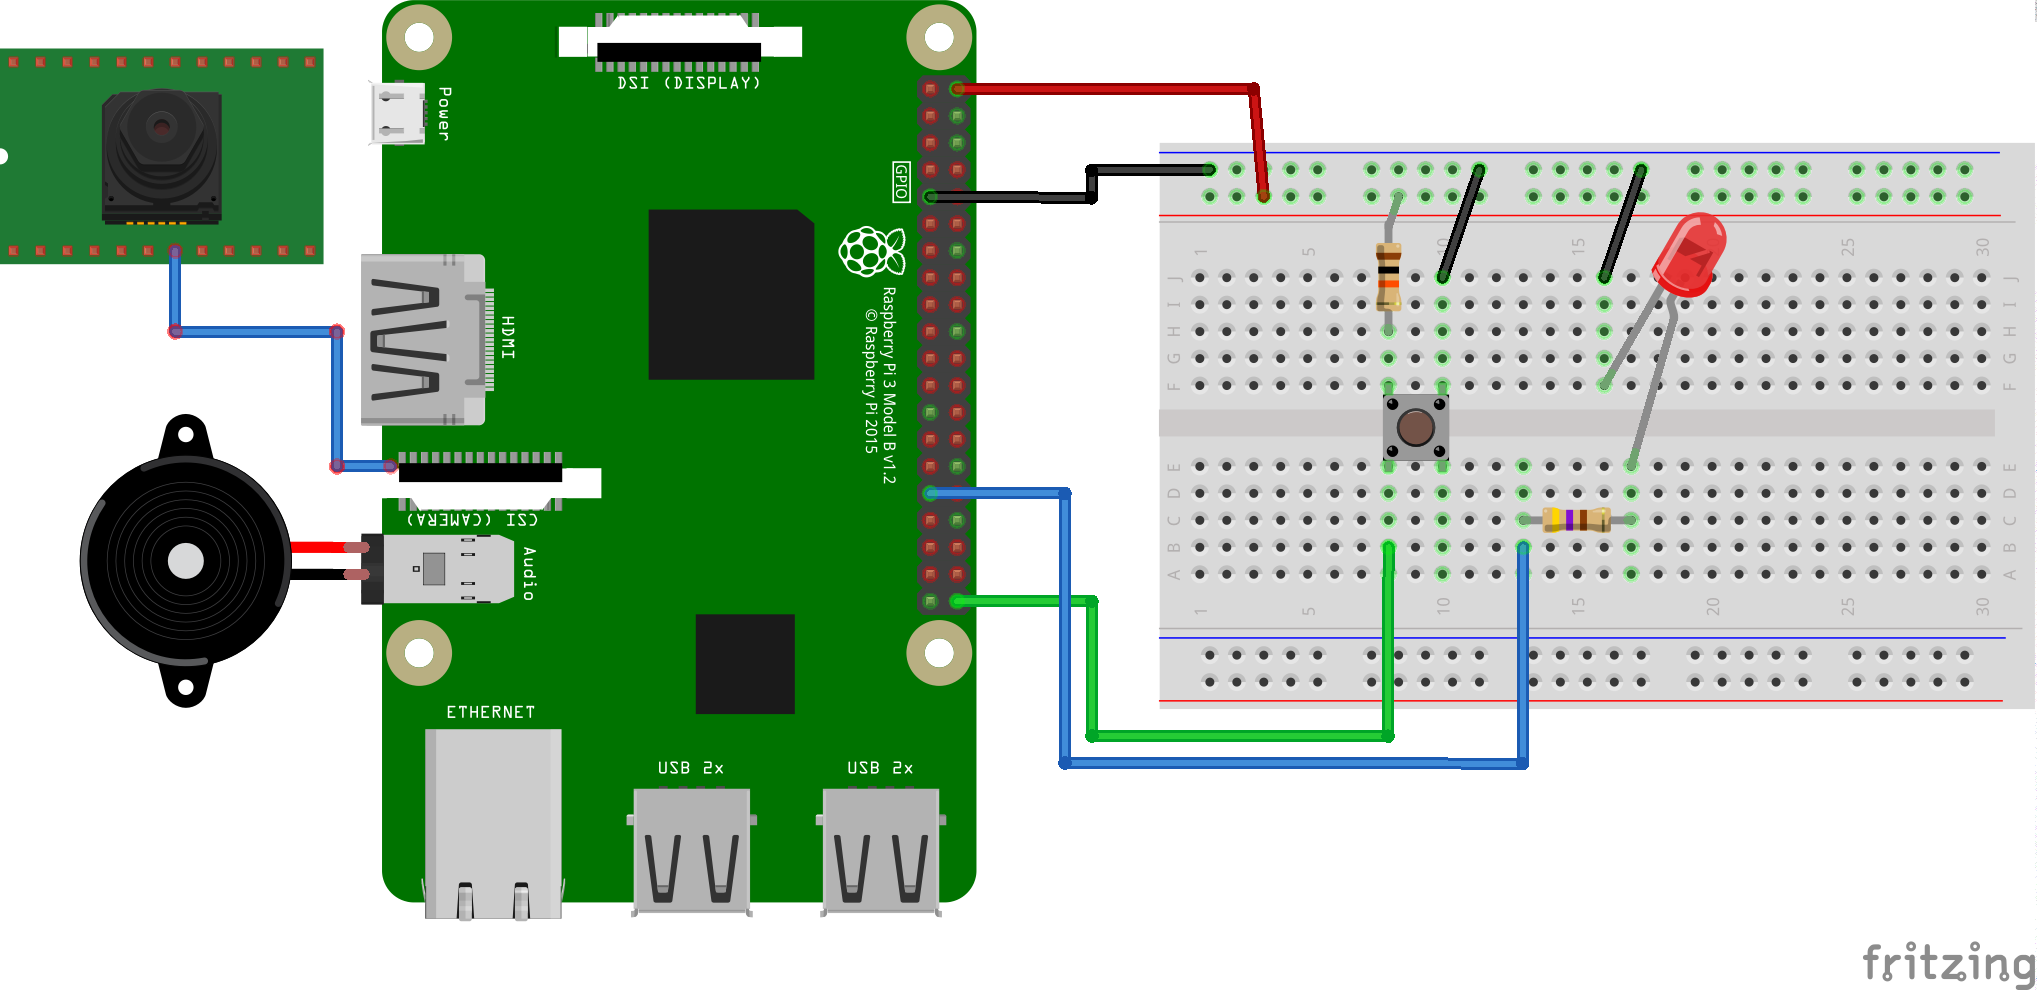
1 push button
2 resistors
1 LED light
1 breadboard
jumper wires
Optional: speaker or earphone set
Optional: HDMI display or Raspberry Pi display
Schematics
Build and Install
On Android Studio, click on the “Run” button.
If you prefer to run on the command line, type
./gradlew installDebug
adb shell am start
com.example.androidthings.imageclassifier/.ImageClassifierActivity
Point the camera to something like a dog, cat or a furniture
Push the button to take a picture
The LED should go off while running. In a Raspberry Pi 3, it takes less
than one second to capture the picture and run it through TensorFlow, and
some extra time to speak the results through Text-To-Speech
Inference results will show in logcat and, if there is a display connected,
both the image and the results will be shown
If there is a speaker or earphones connected, the results will be spoken via
text to speech
License
Copyright 2017 The Android Things Samples Authors.
Licensed under the Apache License, Version 2.0 (the “License”);
you may not use this file except in compliance with the License.
You may obtain a copy of the License at
Unless required by applicable law or agreed to in writing, software
distributed under the License is distributed on an “AS IS” BASIS, WITHOUT
WARRANTIES OR CONDITIONS OF ANY KIND, either express or implied. See the
License for the specific language governing permissions and limitations under
the License.